Pre.S. Click on any map image to enlarge it.
I have written a good deal about what Stockholm’s southern suburb, the island of Södermalm, was like during the 1700’s. The island’s remnants of 18th century suburban fabric depict how the island was developed, built upon, re-built after catastrophic fires, and farmed. Other remnants illustrate how Stockholm’s poorest lived and where they worked. But what about Stockholm’s northern and western suburbs? What was going on in Norrmalm, Östermalm, and on Kungsholmen during the 1700’s?
First, Stockholm’s development reached about this far at the dawn of the 1600’s:
First, Stockholm’s development reached about this far at the dawn of the 1600’s:

Stadsholmen, also known as Gamla Stan or Old Town, was heavily populated while the suburbs to the north and south were very lightly occupied with an organic type of development.
In previous posts, I wrote about how Stockholm’s suburbs were planned in the 1640’s and how that plan still defines today’s urban environment. During the growth spurt of the 1600’s, Stockholm’s administrators couldn’t parcel off lands and build roads fast enough. In fact, the general city plan from 1640 was expanded a few blocks northward around 1645 and then a few blocks eastward in 1647.
In previous posts, I wrote about how Stockholm’s suburbs were planned in the 1640’s and how that plan still defines today’s urban environment. During the growth spurt of the 1600’s, Stockholm’s administrators couldn’t parcel off lands and build roads fast enough. In fact, the general city plan from 1640 was expanded a few blocks northward around 1645 and then a few blocks eastward in 1647.
 |
| This map from 1663 shows the updated Stockholm General Plan. |
By the time Andreas Wijkman drew this map in 1702, Stockholm’s suburbs had clearly exceeded the General Plan’s boundaries.

However, the map does show that quite a few inner blocks remained undeveloped due to difficult topography.

This map is also curious for its display of an exceedingly large number of fantastical Baroque gardens.

While many landowners may have dreamed of such gardens, I’m pretty sure that there were only a few gardens of such grandeur in the city. I’m not sure what was actually on these lots but perhaps they were awaiting development and the cartographer used his vivid imagination. This map segment also shows a few cross-hatched lots that seem to me to be farm fields.
The 1702 Wijkman map shows that Stockholm had begun to develop past the General Plan’s boundaries, but it doesn’t clearly show which lots were built upon and which stood empty. However, Petrus Tillaeus' map from 1733 makes a clear distinction between inhabited lots (pinkish) and uninhabited land (background cream color).
The 1702 Wijkman map shows that Stockholm had begun to develop past the General Plan’s boundaries, but it doesn’t clearly show which lots were built upon and which stood empty. However, Petrus Tillaeus' map from 1733 makes a clear distinction between inhabited lots (pinkish) and uninhabited land (background cream color).

Beyond the boundaries of the General Plan from the 1640’s, development is clustered along major roads, but the more remote areas farther from a main artery remain undeveloped. One example is Hornsgatan, the main east-west thoroughfare on Södermalm.

Biurman’s map from the 1750’s shows roughly the same extent of development as the 1733 Tillaeus map, and it also distinguishes between developed and undeveloped land.

This map is intriguing because it clearly delineates Stockholm’s city limits (which would remain constant until the 1900’s) and because it shows Stockholm in a larger regional context. Although established roads stretch from Stockholm across the region, there clearly wasn’t much development in the area outside of the city limits.

Stockholm’s growth was stagnant throughout the second half of the 18th century, and Akrel’s map from 1805 shows roughly the same extent of development as Biurmas’s map from the 1750’s.

However, Akrel used much more sophisticated measuring technologies and his map gives a much more realistic depiction of Stockholm’s settlement, network of streets, parks, fields, and especially topography.

I am intrigued that Akrel even attempts to depict every individual tree in the city. Sadly, it seems that Stockholm has lost several tree-lined allées since Akrel’s time.

Carpelan’s 1817 map is similar in style to Akrel’s 1805 map, but it places Stockholm within its regional context.

Carpelan’s map clearly distinguishes between farm fields and forests,
and it is interesting to see just how much of Stockholm’s surroundings
were still “wild” into the mid-1800’s.

The cartographer used “depth lines” to distinguish water from land on this black and white tourist map from 1841.
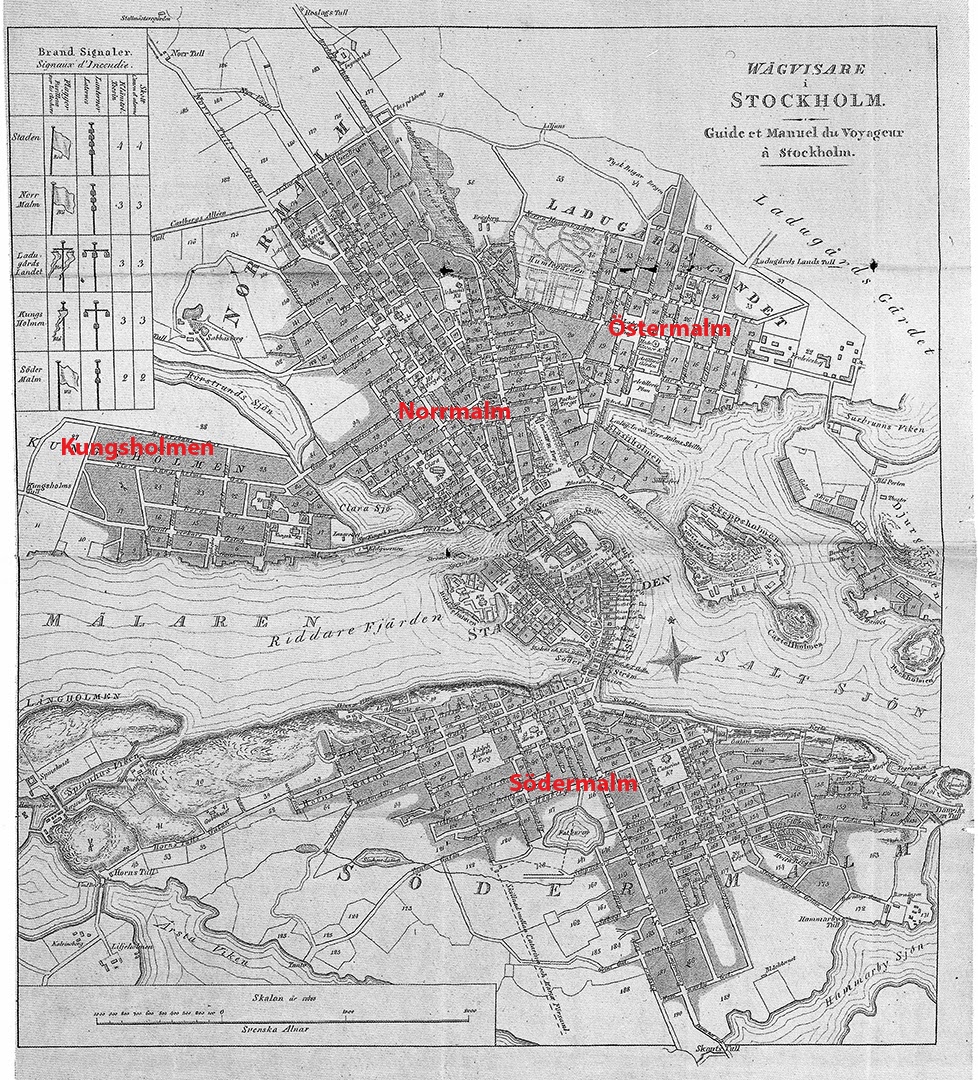
The measuring and drawing of Stockholm’s maps was historically under the military’s purview. After all, it is hard to defend something if you don’t know what it is you’re defending. However, in 1831, Sweden established a civilian Topography Corps which took over the map-making work. The Corps re-measured and re-drew all of Stockholm and its surroundings for its 1861 map. With its use of green and tan, the Corps clearly distinguishes between forests and fields.

Comparing the inner-city portion of the Corps’ 1861 map (right) to Wijkman’s 1702 map (left), it is obvious that Stockholm developed at a snail’s pace throughout the 18th century and through the first half of the 19th century. Very few new blocks were added to the city’s landscape over this 160 year period.

However, in the later years of the 19th century, Stockholm experienced a population spurt as people streamed to the city from the countryside, resulting in a building boom that changed the face of Stockholm. Stockholm quickly filled out to the city limits, bursting at the seams. The building boom lasted throughout the 20th century, and Stockholm’s city limits were repeatedly moved outward to accommodate the growth. I’ll (eventually) cover all of these more modern developments in further posts.
Map Sources:
Stockholmskartor by Nils-Erik Landell (2000)
Stockholm, En Historia i Kartor och Bilder by Helena Friman and Göran Söserström (2008)
Huvudstad i omvandling by Thomas Hall (2002)
Stockholmskartor by Nils-Erik Landell (2000)
Stockholm, En Historia i Kartor och Bilder by Helena Friman and Göran Söserström (2008)
Huvudstad i omvandling by Thomas Hall (2002)
Note: Orienting a map with north up is a relatively modern phenomenon. I have rotated many of the above maps from their original orientation so that north is up in all maps.